views
The post-pandemic recovery led to an active discussion on alphabets, particularly, V- and K-shaped recovery. V-shaped recovery meant a sharp decline followed by a swift recovery in economic activity, while the K-shaped recovery meant rich were getting richer, while the poor were getting poorer. The implication being that inequality in India has increased.
This hypothesis is often supported by anecdotal evidence and the lower two-wheeler sales while an increase in luxury cars being sold. A cautionary note to those who look at two-wheeler sales as a measure of how the poor are doing: as the per-capita income of India expands, its demand will shift away from two-wheeler sales. Therefore, an expanding middle-class would necessarily result in a shrinking demand for two-wheeler sales. The measure is rather going to become meaningless as India’s per-capita incomes reach $5,000 over the coming years.
Anecdotal evidence of this expansion in India’s middle-class is the passengers traveling through India’s domestic airport terminals and with the constant struggle of airport authorities to catch up with the sudden increase in demand. Very likely, this catch-up process will continue for a better part of the coming decade as India’s healthy economic growth adds more households to its middle-class while the state continues to invest and improve infrastructure capacity.
But what is the hard evidence on inequality in India? Has it really gotten worse? If the government was to reduce leakages to the bottom half of the population, provide them with cash transfers, an expanded social safety net in the form of health insurance, construction of toilets, improved access to modern cooking fuel & electricity, along with subsidized housing – even as it increased the marginal tax rate at the top of the income distribution – what would happen to inequality? Put simply, if fiscal policy targets the bottom for resource redistribution, inequality should decline. We know that such a redistribution has been in the works for a better part of the last nine years.
Inequality can be measured in various ways, there is income inequality, consumption inequality, wage inequality and wealth inequality. Historically, India has relied on consumption surveys to draw inferences about poverty (& inequality) so we will restrict our attention to consumption inequality. This measure compares the consumption expenditures of the richer households with those in poorer households. It is this measure that was first presented in the IMF Working Paper that explored the issue of pandemic fiscal transfers on poverty and inequality. A key conclusion then was that consumption inequality has been on a retreat in India contrary to the “popular” narrative of K-shaped recovery.
More recently, even for the US, the issue of widening inequality has been contested in a paper published in one of the top economics journals, sparking a vibrant discussion on issues of measurement and the use of tax data (administrative data).
So, what does data tell us about India’s inequality and its evolution? There are two household surveys that are available for such a comparison — CMIE’s Consumer Pyramid Household Surveys (CPHS) & NSS’s Periodic Labor Force Survey (PLFS). Both these datasets come with their own set of problems. Particularly, the representativeness of the CPHS has been seriously questioned in recent years. The PLFS too suffers from data-quality issues with regards to certain modules of the questionnaire.
However, none of these data issues stop academics from using these data. This is understandable, since there is no other available data, and therefore, we must make the most of whatever is available. In particular, many have used the CMIE data to infer unemployment rates, or even construct poverty measures – but only a few have used it to draw inferences about inequality. Gupta, Malani and Woda in their NBER paper looked at this issue and found evidence of a decline in inequality in India during Covid-19. More importantly, they find that the decline in inequality predates the pandemic and starts from 2018. The pandemic did not change the underlying trend in inequality.
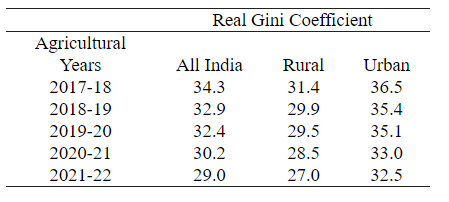
The other data source, PLFS also has questions on consumption expenditures that have been used to arrive at poverty estimates. These estimates are not reliable given that PLFS earlier had just one question on consumption expenditures and in later years, there were just five questions. Nevertheless, while many are comfortable with the use of PLFS data for poverty, not much has been written about the inequality estimates that can be inferred from these data. As we show in the table below, the real Gini Coefficient has come down since 2017-18 in both rural and urban areas. That is, India’s inequality has been on a retreat since 2017.

We circle back to the same question that was asked earlier: what would happen to inequality if a government taxes the rich and redistributes the money among the poor in an efficient manner? Inequality would decline. The limited evidence available from existing data sources supports this conclusion.
Karan Bhasin is a New York based economist. Views expressed in the above piece are personal and solely those of the writer. They do not necessarily reflect News18’s views.


Comments
0 comment