
- Start at (0, 0), or the origin, which is in the center of the coordinate plane.
- Move over x units to the right or left. Then, move over y units up or down. Mark the point.
- If you're working with a linear equation, draw lines connecting points from left to right. For a quadratic equation, connect points with curved lines.
Understanding the Coordinate Plane
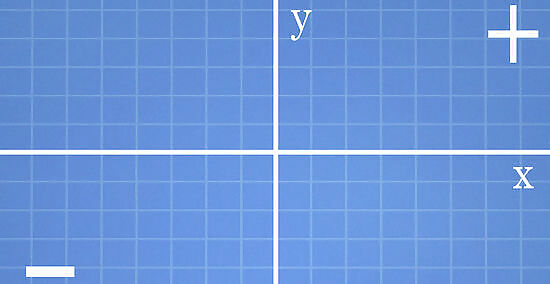
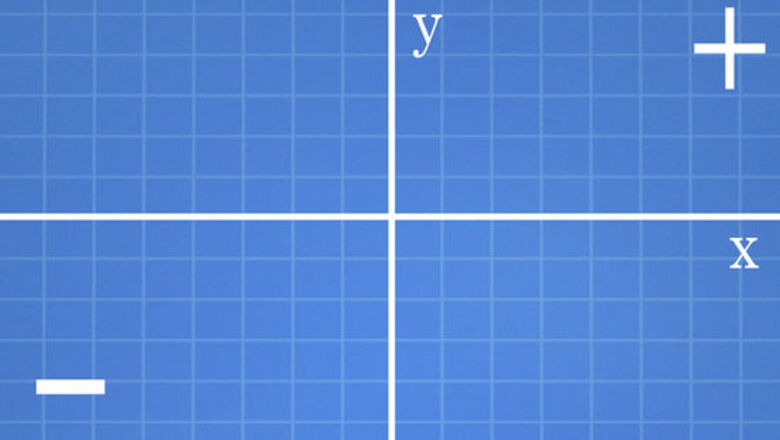
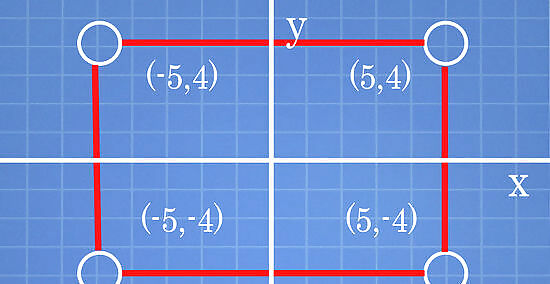
Understand the axes of the coordinate plane. When you're graphing a point on the coordinate plane, you will graph it in (x, y) form. Here is what you'll need to know: The x-axis goes left and right, the second coordinate is on the y-axis. The y-axis goes up and down. Positive numbers go up or right (depending on the axis). Negative numbers go left or down.
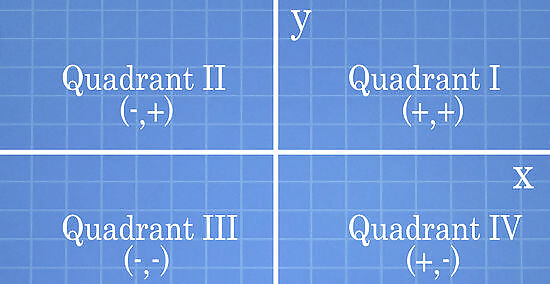
Understand the quadrants on the coordinate plane. Remember that a graph has four quadrants (typically labeled in Roman numerals). You will need to know which quadrant the plane is in. Quadrant I gets (+,+); quadrant I is above and to the left of the y-axis. Quadrant IV gets (+,-); quadrant IV is below the x-axis and to the right of the y-axis. (5,4) is in quadrant I. (-5,4) is in Quadrant II. (-5,-4) is in Quadrant III. (5,-4) is in Quadrant IV.
Graphing a Single Point
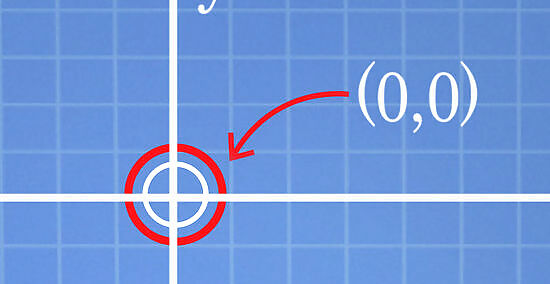
Start at (0, 0), or the origin. Just go to (0, 0), which is the intersection of the x and y axes, right in the center of the coordinate plane.
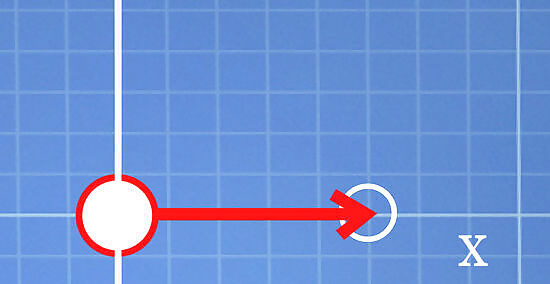
Move over x units to the right or left. Let's say you're working with the set of coordinates (5, -4). Your x coordinate is 5. Since five is positive, you'll need to move over five units to the right. If it was negative, you would move over 5 units to the left.
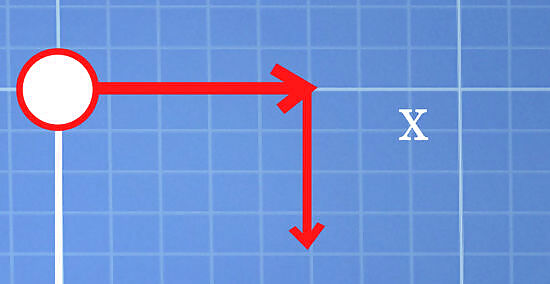
Move over y units up or down. Start where you left off, 5 units to the right of (0, 0). Since your y coordinate is -4, you will have to move down four units. If it were 4, you would move up four units.
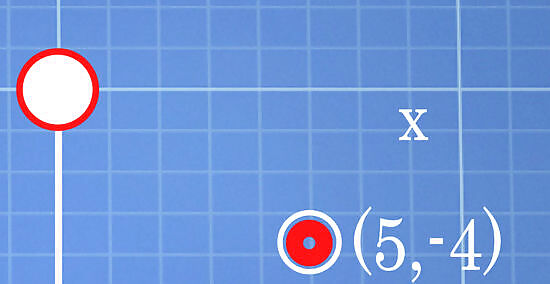
Mark the point. Mark the point you found by moving over 5 units to the right and 4 units down, the point (5, -4), which is in the 4th quadrant. You're all done.
Following Advanced Techniques
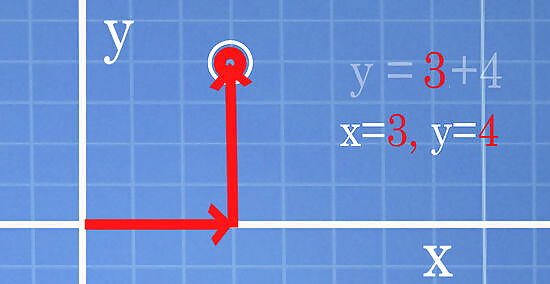
Learn how to graph points if you're working with an equation. If you have a formula without any coordinates, then you'll have to find your points by choosing a random coordinate for x and seeing what the formula spits out for y. Just keep going until you've found enough points and can graph them all, connecting them if necessary. Here's how you can do it, whether you're working with a simple line, or a more complicated equation like a parabola: Graph points from a line. Let's say the equation is y = x + 4. So, pick a random number for x, like 3, and see what you get for y. y = 3 + 4 = 7, so you have found the point (3, 7). Graph points from a quadratic equation. Let's say the equation of the parabola is y = x + 2. Do the same thing: pick a random number for x and see what you get for y. Picking 0 for x is easiest. y = 0 + 2, so y = 2. You have found the point (0, 2).
Connect the points if necessary. If you have to make a line graph, draw a circle, or connect all of the points of a parabola or another quadratic equation, then you'll have to connect the points. If you have a linear equation, then draw lines connecting the points from left to right. If you're working with a quadratic equation, then connect the points with curved lines. Unless you are only graphing a point, you will need at least two points. A line requires two points. A circle requires two points if one is the center; three if the center is not included (Unless your instructor has included the center of the circle in the problem, use three). A parabola requires three points, one being the absolute minimum or maximum; the other two points should be opposites. A hyperbola requires six points; three on each axis.
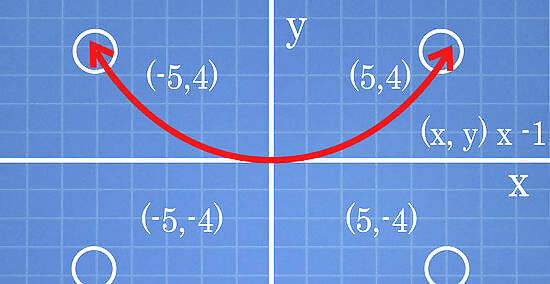
Understand how modifying the equation changes the graph. Here are the different ways that modifying the equation changes the graph: Modifying the x coordinate moves the equation left or right. Adding a constant moves the equation up or down. Turning it negative (multiplying by -1) flips it over; if it is a line, it will change it from going up to down or going down to up. Multiplying it by another number will either increase or decrease the slope.
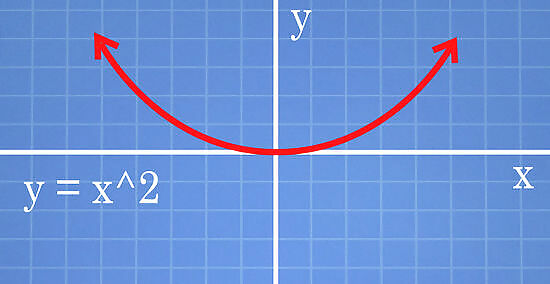
Follow an example to see how modifying the equation changes the graph. Consider the equation y = x^2 ; a parabola with its base at (0,0). Here are the differences you will see as you modify the equation: y = (x-2)^2 is the same parabola, except it is graphed two spaces to the right of the origin; its base is now at (2,0). y = x^2 + 2 is still the same parabola, except now it is graphed two spaces higher at (0,2). y = -x^2 (the negative is applied after the exponent ^2) is an upside down y = x^2; its base is (0,0). y = 5x^2 is still a parabola, but it gets larger even faster, giving it a thinner look.


Comments
0 comment